> ## Documentation Index
> Fetch the complete documentation index at: https://docs.runlayer.com/llms.txt
> Use this file to discover all available pages before exploring further.
# Analytics
> View organization-wide usage and adoption metrics
## Analytics Dashboard
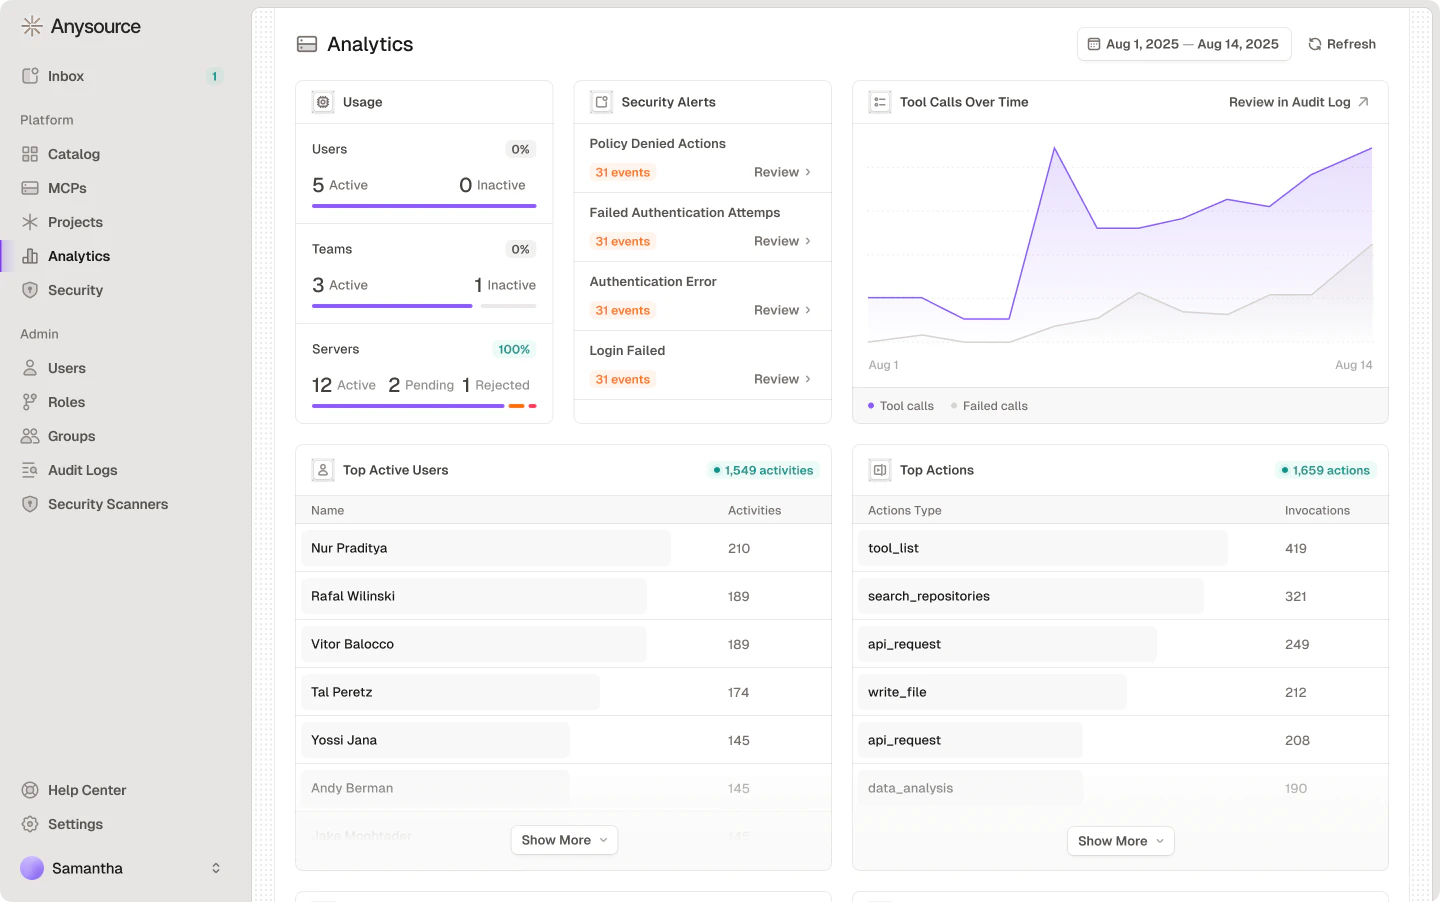 Navigate to **Analytics** to view organization-wide usage and adoption metrics. A date range picker at the top of the page applies to every tab — choose a preset (from **Live**, which auto-refreshes every few seconds, through the last 5 minutes up to the last 90 days) or a custom range. Time-series charts are bucketed hourly in your local timezone, and ranking cards can be re-sorted by either column. The dashboard is organized into tabs:
### Overview
**Usage** — counts and trends for:
* **Users**: Active vs inactive
* **Agents**: Active vs inactive
* **Connectors**: Active, pending, and rejected counts
**Security Alerts** — permission-denied actions, failed authentication attempts (unique IPs), and security violations at a glance (includes both user and [Agent](/platform-agents) activity). Each row links to the relevant filtered view.
**Tasks** — time-series chart of human vs agent tasks over time (replaces the previous tool calls timeline).
**Top Connectors by Usage** — connectors ranked by task count
**Top Tools by Usage** — most invoked MCP tools
**Top Active Accounts** — actors sorted by activity count (capability-gated)
**Most Used Clients** — MCP client applications ranked by total calls
### Connectors
* **Top connectors by tool call**: connectors ranked by raw tool call volume
* **Connector health**: connectors with their success rate percentage
* **Connector usage by client**: per-connector client breakdown
* **Top tools by usage**: tools ranked within the connector context
* **Top resources**: most accessed MCP resources
### Skills
* **Skills inventory**: total, shadow, managed, and outdated counts
* **Skills usage over time**: usage trend chart showing skill adoption
* **Top skills by usage**: ranking of the most-used skills across the organization
* **Top skill creators**: users ranked by number of skills published
* **Skill risk assessment**: skills ranked by security score with per-skill risk level badges (High, Medium, Low, Minimal, Unknown)
### Agents
* **Agents inventory**: total agents, public vs private breakdown, and agents created in the selected period
* **Agent delegation activity**: grants vs revokes over time
* **Agent cost by model**: model ranking by total agent spend
* **Agent token usage**: input vs output token usage over time, charted across the selected date range
* **Agent runs over time**: area chart showing agent run volume across the selected date range
* **Top agents by cost**: agents ranked by total spend
* **Top agents by runs**: agents ranked by total run count
* **Top agents by tool calls**: agents ranked by raw tool call volume
Cost figures (**Agent cost by model**, **Top agents by cost**) are totals for the selected date range — narrow or shift the range to compare spend across periods, and pair them with **Agent token usage** to see how consumption trends over time.
**Model right-sizing**: use **Agent cost by model** to spot which models drive spend, and **Top agents by cost** vs **Top agents by runs** to find agents whose cost is out of proportion to their activity. If an expensive model's agents deliver similar outcomes to cheaper ones, that's a candidate for switching. Each agent's model is configured on its [Agent](/platform-agents) settings.
Analytics cost data is currently agent-oriented in the public docs: model spend, token usage, runs, and tool calls by agent and date range. For per-user, per-session, or business-unit cost analysis, export the available analytics and audit datasets and join them in your internal reporting system. Public docs do not document automatic model recommendations or budget enforcement by user, team, or workflow; hard caps are documented for [agent run limits and cost budgets](/platform-agents#cost-budgets).
### Plugins
* **Plugins inventory**: total, shadow, and managed counts
* **Plugin usage timeline**: usage trend chart
* **Top plugin users**: users ranked by plugin activity
* **Plugin usage by client**: MCP client applications ranked by plugin call volume
## Drilling into specific dimensions
Most ranking rows link to a deeper, filtered view:
* **Connectors**: rows in **Top connectors by usage**, **Top connectors by tool call**, and **Connector health** open that connector's detail page on its metrics tab, showing its own usage breakdown. The **Connector usage** timeline also offers a per-connector "review in audit log" jump.
* **Users and agents**: rows in **Top active accounts** open [Audit Logs](/platform-audit-logs) pre-filtered to that actor and the currently selected date range.
* **Security Alerts**: each row links to the matching filtered audit log view.
* **Skills**: rows in **Top skills by usage** open a preview of that skill.
For anything beyond the built-in drill-downs — ad-hoc slicing or CSV exports for external reporting — use [Runlayer MCP](/runlayer-mcp): its admin-only analytics export tools return the same underlying dashboard datasets (plus per-server tool health and usage breakdowns) as CSV, and audit logs can be bulk-exported for per-user analysis.
Shadow discovery metrics (MCP servers and skills) now live on the dedicated [Shadow](/shadow-ai) page in the sidebar. Want ad-hoc reporting or CSV exports in your AI client? Use{" "}
Runlayer MCP.
***
## Related Resources
Activity history and investigations
Navigate to **Analytics** to view organization-wide usage and adoption metrics. A date range picker at the top of the page applies to every tab — choose a preset (from **Live**, which auto-refreshes every few seconds, through the last 5 minutes up to the last 90 days) or a custom range. Time-series charts are bucketed hourly in your local timezone, and ranking cards can be re-sorted by either column. The dashboard is organized into tabs:
### Overview
**Usage** — counts and trends for:
* **Users**: Active vs inactive
* **Agents**: Active vs inactive
* **Connectors**: Active, pending, and rejected counts
**Security Alerts** — permission-denied actions, failed authentication attempts (unique IPs), and security violations at a glance (includes both user and [Agent](/platform-agents) activity). Each row links to the relevant filtered view.
**Tasks** — time-series chart of human vs agent tasks over time (replaces the previous tool calls timeline).
**Top Connectors by Usage** — connectors ranked by task count
**Top Tools by Usage** — most invoked MCP tools
**Top Active Accounts** — actors sorted by activity count (capability-gated)
**Most Used Clients** — MCP client applications ranked by total calls
### Connectors
* **Top connectors by tool call**: connectors ranked by raw tool call volume
* **Connector health**: connectors with their success rate percentage
* **Connector usage by client**: per-connector client breakdown
* **Top tools by usage**: tools ranked within the connector context
* **Top resources**: most accessed MCP resources
### Skills
* **Skills inventory**: total, shadow, managed, and outdated counts
* **Skills usage over time**: usage trend chart showing skill adoption
* **Top skills by usage**: ranking of the most-used skills across the organization
* **Top skill creators**: users ranked by number of skills published
* **Skill risk assessment**: skills ranked by security score with per-skill risk level badges (High, Medium, Low, Minimal, Unknown)
### Agents
* **Agents inventory**: total agents, public vs private breakdown, and agents created in the selected period
* **Agent delegation activity**: grants vs revokes over time
* **Agent cost by model**: model ranking by total agent spend
* **Agent token usage**: input vs output token usage over time, charted across the selected date range
* **Agent runs over time**: area chart showing agent run volume across the selected date range
* **Top agents by cost**: agents ranked by total spend
* **Top agents by runs**: agents ranked by total run count
* **Top agents by tool calls**: agents ranked by raw tool call volume
Cost figures (**Agent cost by model**, **Top agents by cost**) are totals for the selected date range — narrow or shift the range to compare spend across periods, and pair them with **Agent token usage** to see how consumption trends over time.
**Model right-sizing**: use **Agent cost by model** to spot which models drive spend, and **Top agents by cost** vs **Top agents by runs** to find agents whose cost is out of proportion to their activity. If an expensive model's agents deliver similar outcomes to cheaper ones, that's a candidate for switching. Each agent's model is configured on its [Agent](/platform-agents) settings.
Analytics cost data is currently agent-oriented in the public docs: model spend, token usage, runs, and tool calls by agent and date range. For per-user, per-session, or business-unit cost analysis, export the available analytics and audit datasets and join them in your internal reporting system. Public docs do not document automatic model recommendations or budget enforcement by user, team, or workflow; hard caps are documented for [agent run limits and cost budgets](/platform-agents#cost-budgets).
### Plugins
* **Plugins inventory**: total, shadow, and managed counts
* **Plugin usage timeline**: usage trend chart
* **Top plugin users**: users ranked by plugin activity
* **Plugin usage by client**: MCP client applications ranked by plugin call volume
## Drilling into specific dimensions
Most ranking rows link to a deeper, filtered view:
* **Connectors**: rows in **Top connectors by usage**, **Top connectors by tool call**, and **Connector health** open that connector's detail page on its metrics tab, showing its own usage breakdown. The **Connector usage** timeline also offers a per-connector "review in audit log" jump.
* **Users and agents**: rows in **Top active accounts** open [Audit Logs](/platform-audit-logs) pre-filtered to that actor and the currently selected date range.
* **Security Alerts**: each row links to the matching filtered audit log view.
* **Skills**: rows in **Top skills by usage** open a preview of that skill.
For anything beyond the built-in drill-downs — ad-hoc slicing or CSV exports for external reporting — use [Runlayer MCP](/runlayer-mcp): its admin-only analytics export tools return the same underlying dashboard datasets (plus per-server tool health and usage breakdowns) as CSV, and audit logs can be bulk-exported for per-user analysis.
Shadow discovery metrics (MCP servers and skills) now live on the dedicated [Shadow](/shadow-ai) page in the sidebar. Want ad-hoc reporting or CSV exports in your AI client? Use{" "}
Runlayer MCP.
***
## Related Resources
Activity history and investigations