> ## Documentation Index
> Fetch the complete documentation index at: https://docs.runlayer.com/llms.txt
> Use this file to discover all available pages before exploring further.
# Audit Logs
> Track all MCP activity and access history
## Viewing Audit Logs
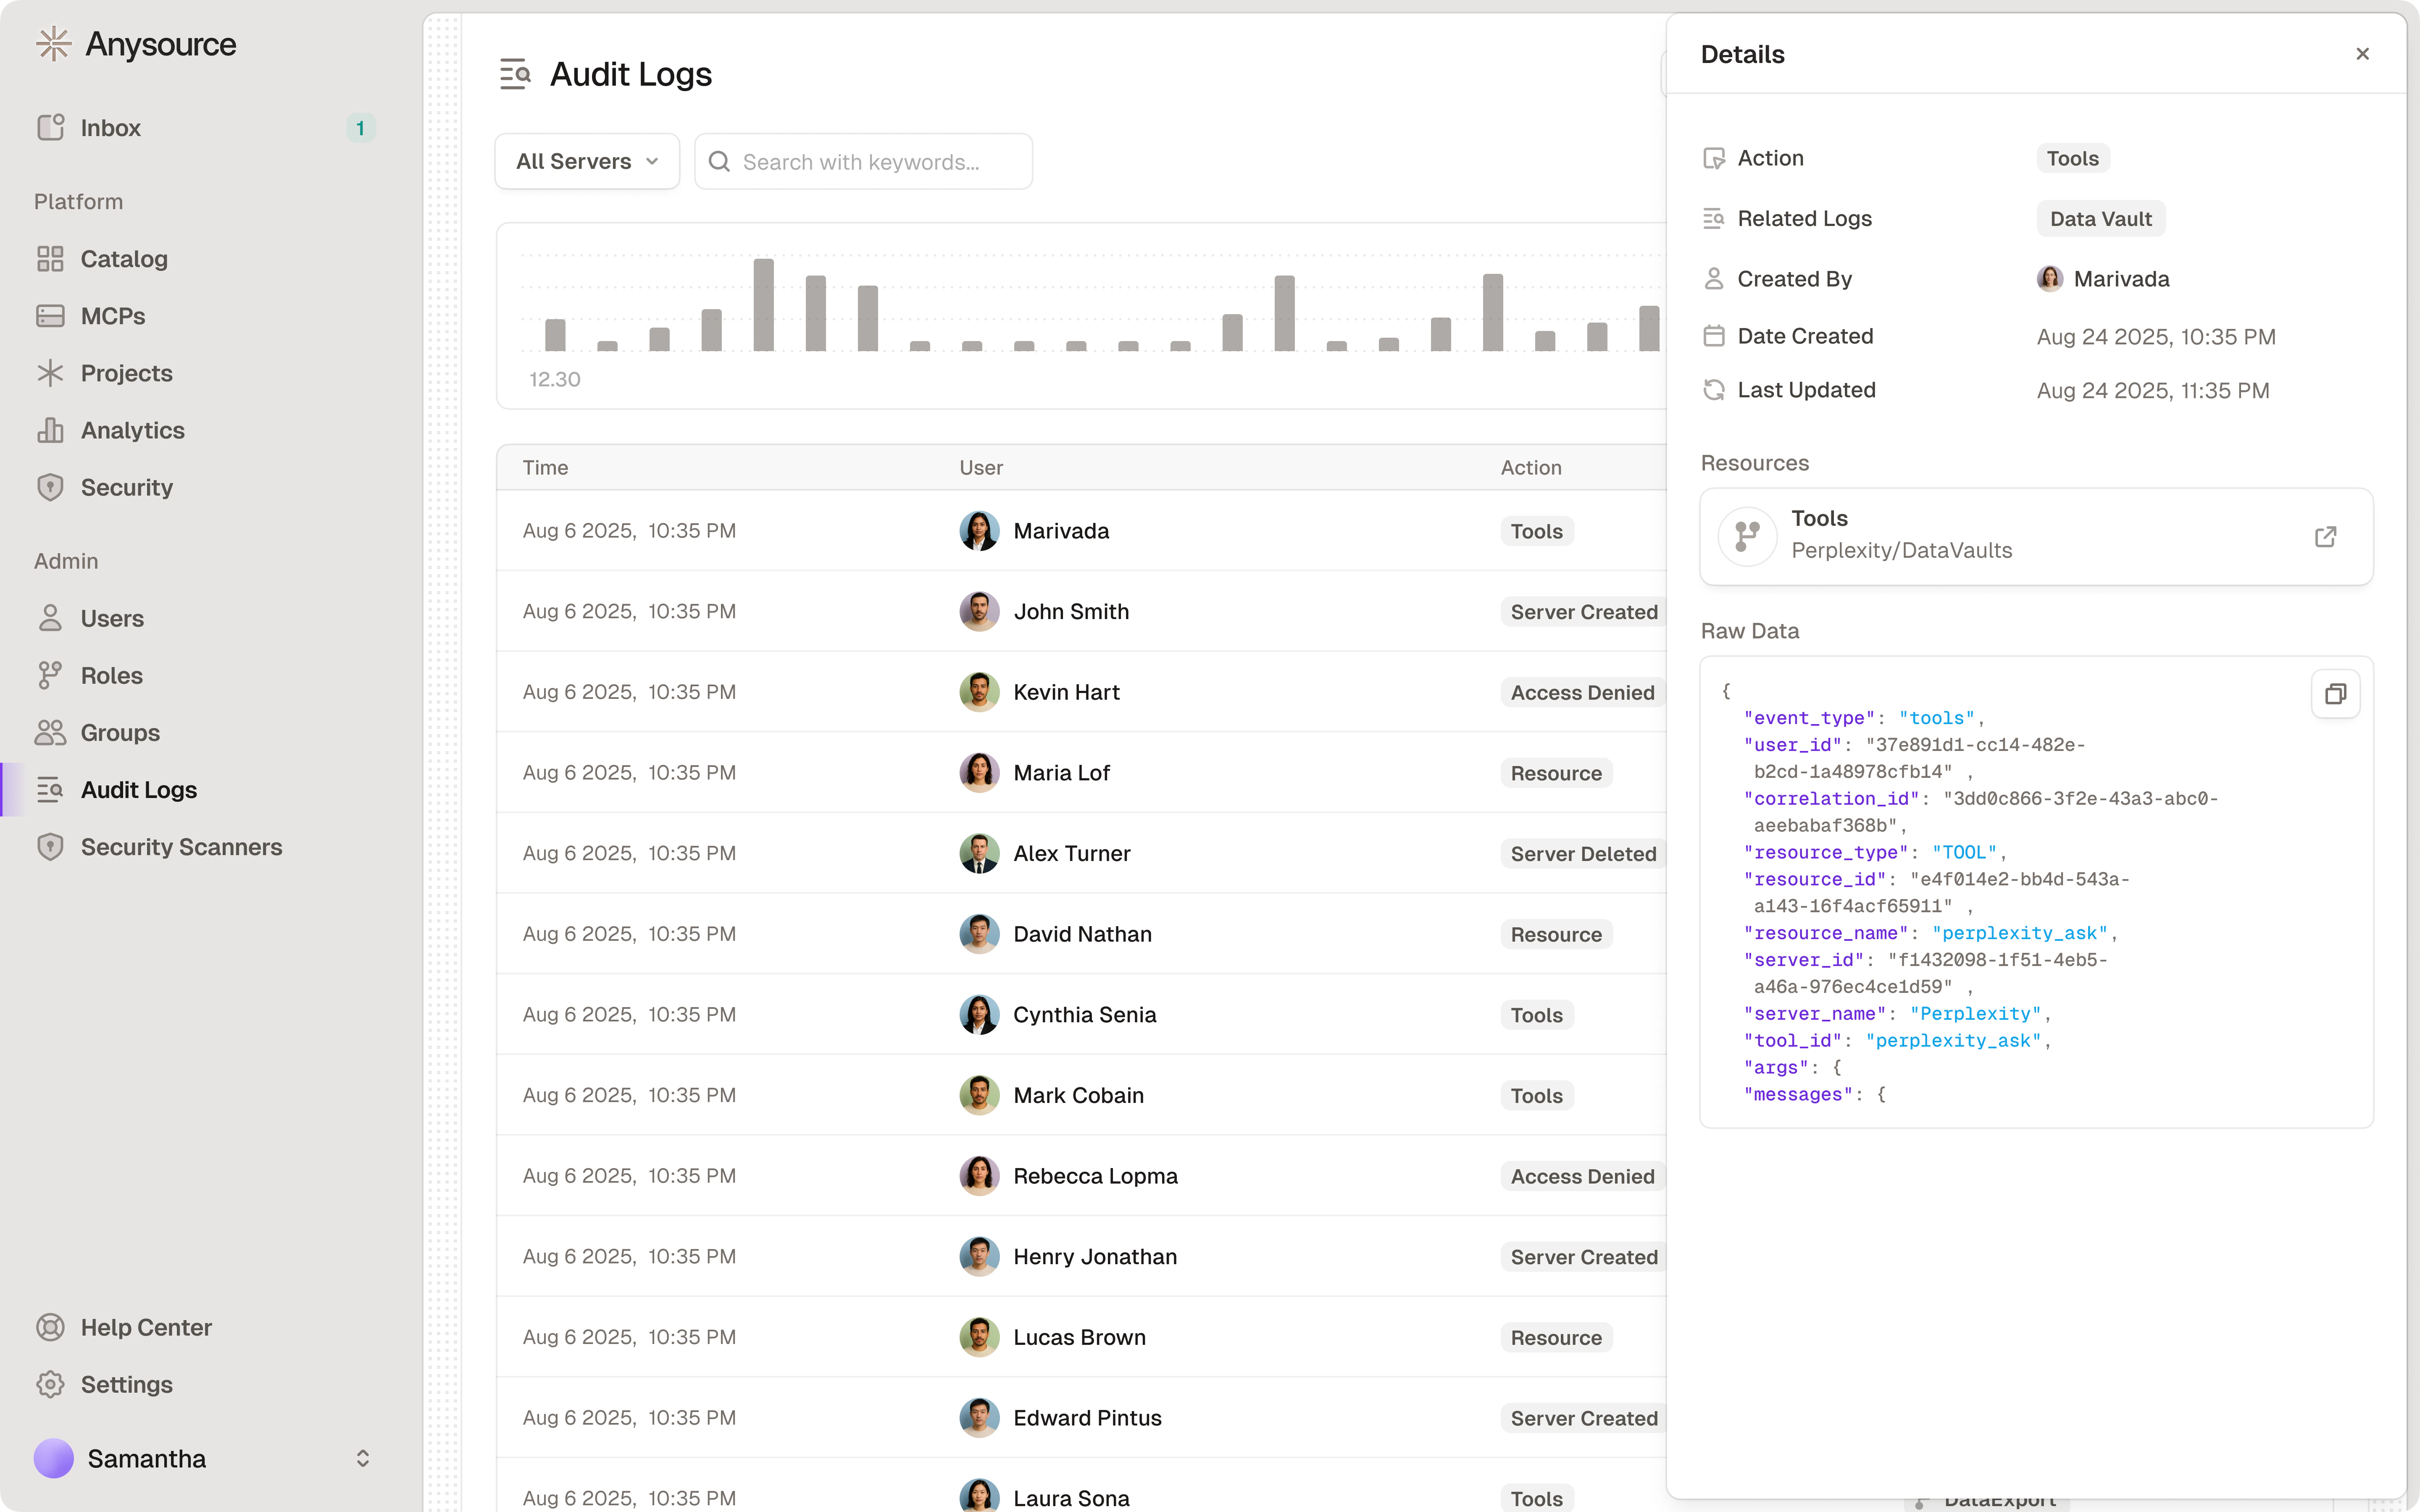 Every action in Runlayer is logged for security and compliance:
1. **Navigate to Audit Logs** in the sidebar
2. **Filter by:**
* Date range
* Action type (created, deleted, accessed, etc.)
* User
* Resource (specific MCP server)
* Plugin (plugin lifecycle and plugin-proxied tool calls)
* Client (MCP client application, e.g. Cursor, Claude Desktop)
* Correlation ID
* Request ID
3. **Click on any log entry** to see full details
***
## What Gets Logged
* MCP server creation, configuration, and deletion
* Skill creation, update, and deletion
* Plugin creation, update, and deletion
* Access requests and approvals
* Policy changes
* User authentication events
* Tool calls and API requests (including skill and plugin proxy calls) — tool call events include ToolGuard scan metadata (scanner name, score, duration) when security scanners are active
* Agent run lifecycle (start, success, failure) — including source, model, and duration
* Agent artifact lifecycle (creation, update, deletion)
* Agent account lifecycle (creation, credential rotation, deletion)
* OAuth token refresh events (upstream success/failure, client-side failures)
* Security violations and risk assessments
All logs are tamper-proof and retained for compliance purposes.
Prompts and model reasoning are not part of audit logs. They are captured in
[Sessions](/platform-sessions), which are short-term operational monitoring
data built from client hooks and agent telemetry. Audit Logs remain the
long-term system of record for tool calls, policy decisions, security
events, and administrative activity.
Need to query or bulk-export audit logs programmatically? Use the{" "}
Runlayer MCP audit log tools — including
Every action in Runlayer is logged for security and compliance:
1. **Navigate to Audit Logs** in the sidebar
2. **Filter by:**
* Date range
* Action type (created, deleted, accessed, etc.)
* User
* Resource (specific MCP server)
* Plugin (plugin lifecycle and plugin-proxied tool calls)
* Client (MCP client application, e.g. Cursor, Claude Desktop)
* Correlation ID
* Request ID
3. **Click on any log entry** to see full details
***
## What Gets Logged
* MCP server creation, configuration, and deletion
* Skill creation, update, and deletion
* Plugin creation, update, and deletion
* Access requests and approvals
* Policy changes
* User authentication events
* Tool calls and API requests (including skill and plugin proxy calls) — tool call events include ToolGuard scan metadata (scanner name, score, duration) when security scanners are active
* Agent run lifecycle (start, success, failure) — including source, model, and duration
* Agent artifact lifecycle (creation, update, deletion)
* Agent account lifecycle (creation, credential rotation, deletion)
* OAuth token refresh events (upstream success/failure, client-side failures)
* Security violations and risk assessments
All logs are tamper-proof and retained for compliance purposes.
Prompts and model reasoning are not part of audit logs. They are captured in
[Sessions](/platform-sessions), which are short-term operational monitoring
data built from client hooks and agent telemetry. Audit Logs remain the
long-term system of record for tool calls, policy decisions, security
events, and administrative activity.
Need to query or bulk-export audit logs programmatically? Use the{" "}
Runlayer MCP audit log tools — including export\_audit\_logs for JSON/CSV exports with no 90-day hot-window restriction.
***
## Retention
Audit logs are retained in two tiers:
* **Hot window (90 days by default)** — recent events live in the database and power the in-app viewer, filters, and CLI queries.
* **S3 archive** — events older than the hot window are archived to S3 rather than deleted, and remain available through the Runlayer MCP `export_audit_logs` tool, which is not subject to the hot-window restriction.
On self-hosted deployments the hot window is configurable via the `audit_log_archive_hot_window_days` Terraform variable (default 90). For retention fully under your own control, enable [SIEM Export](#siem-export-s3) — every event is delivered to S3 in near real-time, and you set the lifecycle policy on the destination.
***
## Sensitive Connector Redaction
Connectors that handle highly sensitive data (e.g. HR systems, financial databases) can be marked as **sensitive** by a Super Admin. When enabled, tool call arguments, results, errors, and security scan details are automatically redacted from audit log entries for that connector.
### What gets redacted
| Event type | Redacted fields |
| -------------------------------- | ------------------------------------------------- |
| Tool calls and resource access | `args`, `result`, `error` |
| Security violations and warnings | `scan_input`, `area_of_concern`, `detected_items` |
Metadata such as tool name, server name, timestamps, and actor information remain visible so admins can still see *who* called *what* and *when* — just not the payload contents.
### Enabling sensitive mode
1. Navigate to the connector's settings (Super Admin only)
2. Enable **Sensitive audit log**
3. Optionally select viewer roles that should see unredacted data
4. Save — redaction takes effect immediately for all future and existing log entries
Redaction is applied at read time, not at write time. The underlying audit log data is unchanged. If you later disable sensitive mode or add a viewer role, previously redacted entries become visible again.
***
## Querying from the CLI
The `uvx runlayer logs` command lets you query audit logs from the terminal. By default it shows your own events from the last 7 days.
```bash theme={null}
uvx runlayer logs
```
### Options
| Flag | Description |
| --------------- | ------------------------------------------------------------------------------------------------------------ |
| `--type, -t` | Filter by action type(s). Comma-separated or use shortcuts: `auth`, `tools`, `security`, `servers`, `agents` |
| `--server-id` | Filter by MCP server UUID |
| `--agent-id` | Filter by agent account UUID |
| `--client-name` | Filter by client name in event details |
| `--user-id` | Filter by user ID (admin only, defaults to self) |
| `--all` | Show all users' logs (admin only) |
| `--start` | Start time (ISO 8601). Default: 7 days ago |
| `--end` | End time (ISO 8601). Default: now |
| `--limit, -n` | Max events to return (default 50, max 2000) |
| `--json` | Output raw JSON for scripting |
### Examples
```bash theme={null}
# View security events from the last 7 days
uvx runlayer logs --type security
# View tool calls for a specific server
uvx runlayer logs --type tools --server-id
# View all auth events as JSON
uvx runlayer logs -t auth --json
# View all users' events (admin only)
uvx runlayer logs --all --type tools
# View events in a specific time range
uvx runlayer logs --start 2026-03-20T00:00:00Z --end 2026-03-27T00:00:00Z
```
When the result set is larger than `--limit`, the CLI prints a next-page command you can copy-paste to continue paginating.
***
## SIEM Export (S3)
Runlayer can continuously export audit logs to S3 for ingestion into your SIEM (e.g. CrowdStrike NG-SIEM, Splunk, Sentinel). Once enabled, every audit event is written as a gzip-compressed JSON file in near real-time.
### How it works
Runlayer supports two S3 delivery patterns:
1. **Runlayer-owned bucket** — Runlayer writes audit log objects to an S3 bucket in the AWS account that hosts your Runlayer instance. Your team provides an IAM role ARN, and Runlayer grants that role read/list access so your SIEM pipeline can pull objects from the bucket.
2. **Customer-owned bucket** — your team provides a destination S3 bucket and prefix that you control. You grant the Runlayer export role write access to that bucket/prefix, and Runlayer writes audit log objects directly there.
In both patterns, each audit log is enqueued to an internal outbox and asynchronously exported as a `.json.gz` file. Most SIEMs support S3 as a native log source.
Runlayer does not need to assume a customer-owned IAM role for either pattern. In the Runlayer-owned bucket pattern, your role reads from the Runlayer export bucket. In the customer-owned bucket pattern, the Runlayer export role writes directly to your bucket.
### S3 object layout
Objects are written with a Hive-style date partition prefix. The default prefix is `audit-logs/`:
```
audit-logs/year=2026/month=04/day=08/.json.gz
```
If a tool call produced a large result payload, it is stored alongside the main event:
```
audit-logs/year=2026/month=04/day=08/payloads/-result.json
```
For customer-owned bucket delivery, your Runlayer team can configure a custom prefix, such as:
```
runlayer/audit-logs/year=2026/month=04/day=08/.json.gz
```
### Payload schema
Each exported file contains a single JSON object:
```json theme={null}
{
"schema_version": 1,
"audit_log_id": "uuid",
"timestamp": "2026-04-08T12:00:00+00:00",
"action_type": "TOOL_CALL_SUCCESS",
"actor_id": "uuid",
"actor_type": "user",
"resource_type": "server",
"resource_id": "uuid",
"resource_name": "my-connector",
"details": { ... }
}
```
### Getting started
To enable SIEM export for your organization, contact your Runlayer account team. You will need to:
1. **Choose a delivery pattern**: Runlayer-owned bucket with pull-based ingestion, or customer-owned bucket with direct delivery.
2. **For Runlayer-owned bucket delivery**, provide the IAM role ARN your SIEM pipeline will use to read/list exported objects.
3. **For customer-owned bucket delivery**, provide the bucket name and prefix, and grant the Runlayer export role `s3:PutObject`, `s3:AbortMultipartUpload`, and `s3:PutObjectTagging` on that prefix.
4. **If your bucket uses SSE-KMS**, grant the Runlayer export role the required KMS permissions for writes.
The S3 export is independent of the in-app audit log viewer and the CSV/JSON download export. All three can be used simultaneously.
CrowdStrike NG-SIEM, Splunk, and most major SIEMs support S3 as a native data source. Use your SIEM's S3 connector and point it at the bucket to start ingesting Runlayer audit events.
### Scope and destinations
* **SIEM export covers audit logs only.** [Session](/platform-sessions) data (prompts, reasoning, session timelines) is not exported to S3 or SIEMs — sessions are short-term operational data reviewed in the Runlayer app.
* **S3 is the delivery mechanism.** There is no direct Runlayer-to-Datadog (or other SIEM) integration; any SIEM that can ingest logs from S3 can consume the export. The Datadog MCP connector available in Runlayer is for proxying Datadog tool calls through the gateway — it is not a log export destination.
***
## Related Resources
Monitor agent activity in real time