Analytics Dashboard
Overview
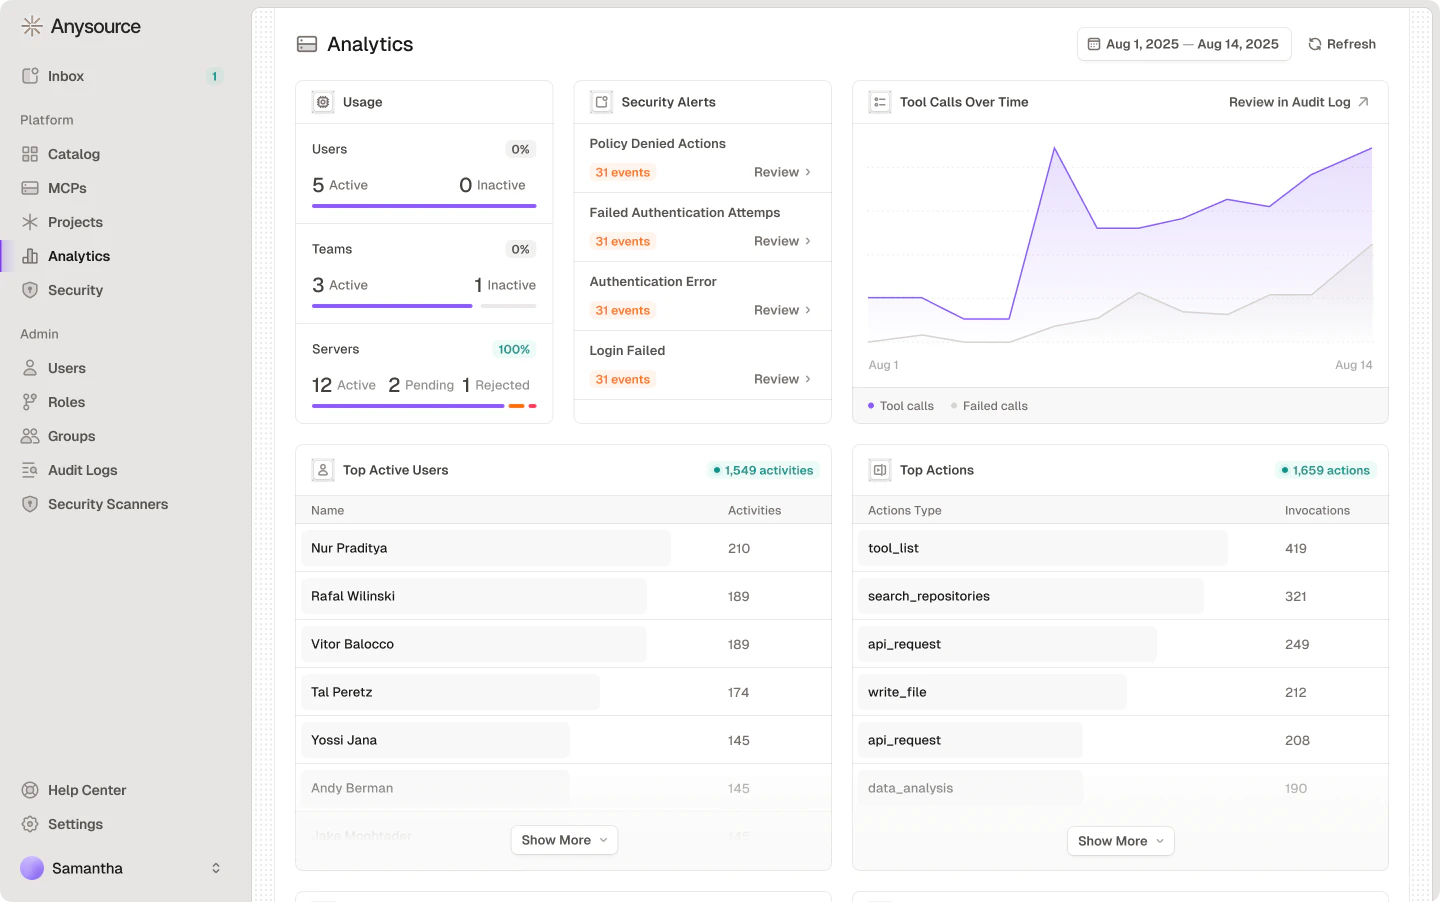
Usage — counts and trends for:- Users: Active vs inactive
- Agents: Active vs inactive
- Connectors: Active, pending, and rejected counts
Connectors
- Top connectors by tool call: connectors ranked by raw tool call volume
- Connector health: connectors with their success rate percentage
- Connector usage by client: per-connector client breakdown
- Top tools by usage: tools ranked within the connector context
- Top resources: most accessed MCP resources
Skills
- Skills inventory: total, shadow, managed, and outdated counts
- Skills usage over time: usage trend chart showing skill adoption
- Top skills by usage: ranking of the most-used skills across the organization
- Top skill creators: users ranked by number of skills published
- Skill risk assessment: skills ranked by security score with per-skill risk level badges (High, Medium, Low, Minimal, Unknown)
Agents
- Agents inventory: total agents, public vs private breakdown, and agents created in the selected period
- Agent delegation activity: grants vs revokes over time
- Agent cost by model: model ranking by total agent spend
- Agent token usage: input vs output token usage over time
- Agent runs over time: area chart showing agent run volume across the selected date range
- Top agents by cost: agents ranked by total spend
- Top agents by runs: agents ranked by total run count
- Top agents by tool calls: agents ranked by raw tool call volume
Plugins
- Plugins inventory: total, shadow, and managed counts
- Plugin usage timeline: usage trend chart
- Top plugin users: users ranked by plugin activity
- Plugin usage by client: MCP client applications ranked by plugin call volume
Related Resources
Audit Logs
Activity history and investigations